

One headline number lit up talk radio: $181,000 “spent on” each poor family — but the math hides a catch.
Story Snapshot
- Townhall claims $1.256 trillion in 2025 low-income spending equals $181,000 per poor family
- Census’s official poverty count excludes SNAP, Medicaid, housing aid, and tax credits
- USDA shows $147.9 billion for food aid in 2025; SNAP averaged 42 million people monthly
- Supplemental Poverty Measure counts noncash aid and shows large anti-poverty impacts
What the $181,000 claim says and how it was built
Townhall reported that the federal government spent $1.256 trillion in fiscal year 2025 on major low-income programs and said this equals about $35,000 per person in poverty, or $181,000 per family, using the Census Bureau’s official poverty count as the denominator. The piece cites Office of Management and Budget data but does not publish the program list behind the total. That gap matters because the official poverty metric used does not count most of what those programs deliver.
Census explains the official poverty measure uses pre-tax cash income and omits noncash benefits like food aid, housing subsidies, and Medicaid, along with tax credits. Dividing an all-in spending total by a cash-income poverty count mixes two different accounting frames. The result looks explosive on a per-family basis but reflects a mismatch in how resources and need are counted, not a check that any family receives. As a headline, it grabs attention; as analysis, it needs a correction for scope.
What the official measure misses — and why that skews the ratio
The official poverty rate ignores the very benefits critics say cost too much: food aid, health coverage, housing help, and tax credits. That means the denominator excludes families made better off by these benefits. The Supplemental Poverty Measure was built to fix this by counting noncash aid and subtracting necessary expenses to estimate real resources. When measured that way, key programs show large anti-poverty effects that the official rate cannot capture.
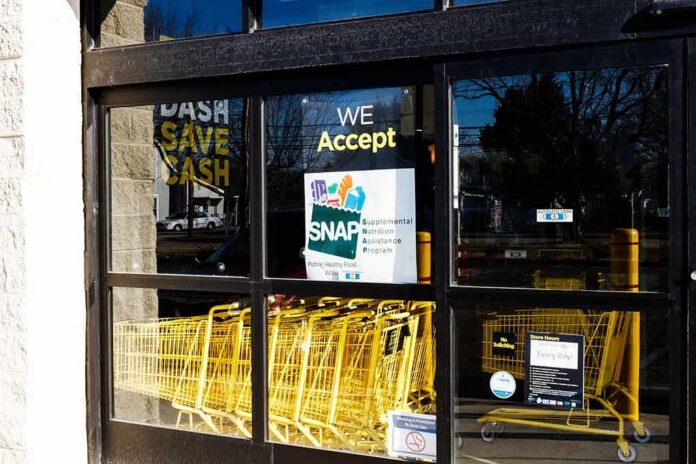
Consider food aid. The Department of Agriculture’s Economic Research Service reports $147.9 billion for food and nutrition assistance in 2025, with $101.7 billion for the Supplemental Nutrition Assistance Program and 42.1 million monthly participants. That is massive scale, not a rounding error. Under the Supplemental Poverty Measure, government analysts can model how such benefits change poverty counts, rather than pretending they do not exist in the first place.
What credible measures say about results
The Census Bureau’s Supplemental Poverty Measure tools credit Social Security and refundable tax credits with the largest impacts, keeping tens of millions out of poverty. That does not excuse waste or fraud, but it says real resources matter. USDA and respected research groups have also found strong effects from food aid on the depth and severity of poverty, not just the headline rate. The upshot: when you count what government actually provides, the picture shifts from “nothing works” to “some big pieces work.”
Conservatives value precision, incentives, and stewardship. On that score, the $181,000 per-family figure overshoots because it treats an umbrella of in-kind and health benefits as if they were cash given to a tiny pool of poor families defined by a metric that ignores those very benefits. A better test asks two simple questions: how much did each program cost, and how much did it reduce poverty when measured by total resources? That is the clean, apples-to-apples audit taxpayers deserve.
The right way to judge value — and what to do next
Program-by-program scorecards should compare federal outlays to measured poverty reduction under the Supplemental Poverty Measure, with clear reporting of administrative costs and improper payments. USDA, the Department of Health and Human Services, and the Department of Housing and Urban Development all publish audits; Congress can demand tighter cross-checks to reduce duplication and churn. The goal is not a shock number. The goal is fewer poor families tomorrow than today, at a price that respects the worker who funds it.
Three steps would raise the bar. First, publish the exact Office of Management and Budget tables behind any trillion-dollar totals, with a program list and inclusion rules. Second, publish the family or household denominator used, so readers see the unit of analysis. Third, anchor results to the Supplemental Poverty Measure so noncash aid and tax credits count. If that audit shows a weak payoff, cut or redesign. If it shows a strong payoff, keep it and trim overhead. That is conservative common sense.
Sources:
townhall.com, census.gov, ers.usda.gov
© conservativesense.com 2026. All rights reserved.